Are the voters on Twitter typical of the rest of us?

The widespread and easy availability of data from Twitter makes it a popular source of insight into what the public is doing, thinking, eating, watching or buying. The Times’s Redbox newsletter for example now regularly features assessments of the different party leaders based on analysis of tweets.
But is this data reliable? Are people on Twitter representative of the rest of us? Much analysis – too much analysis, in fact – rests on the hope that it is.
Courtesy of pollsters GfK we now have some new data on this question. The pollster both polled likely voters as to their voting intention and then also looked at just those who are active on Twitter. The results were rather different – with Labour much more popular amongst Twitter user than amongst voters overall, and the Conservatives much less. Other parties were not much different between the two.
Full voting figures: Conservative 41%, Labour 28%.
Twitter-only voting figures: Conservative 30%, Labour 39%.
A warning not to assume that Twitter = everyone.
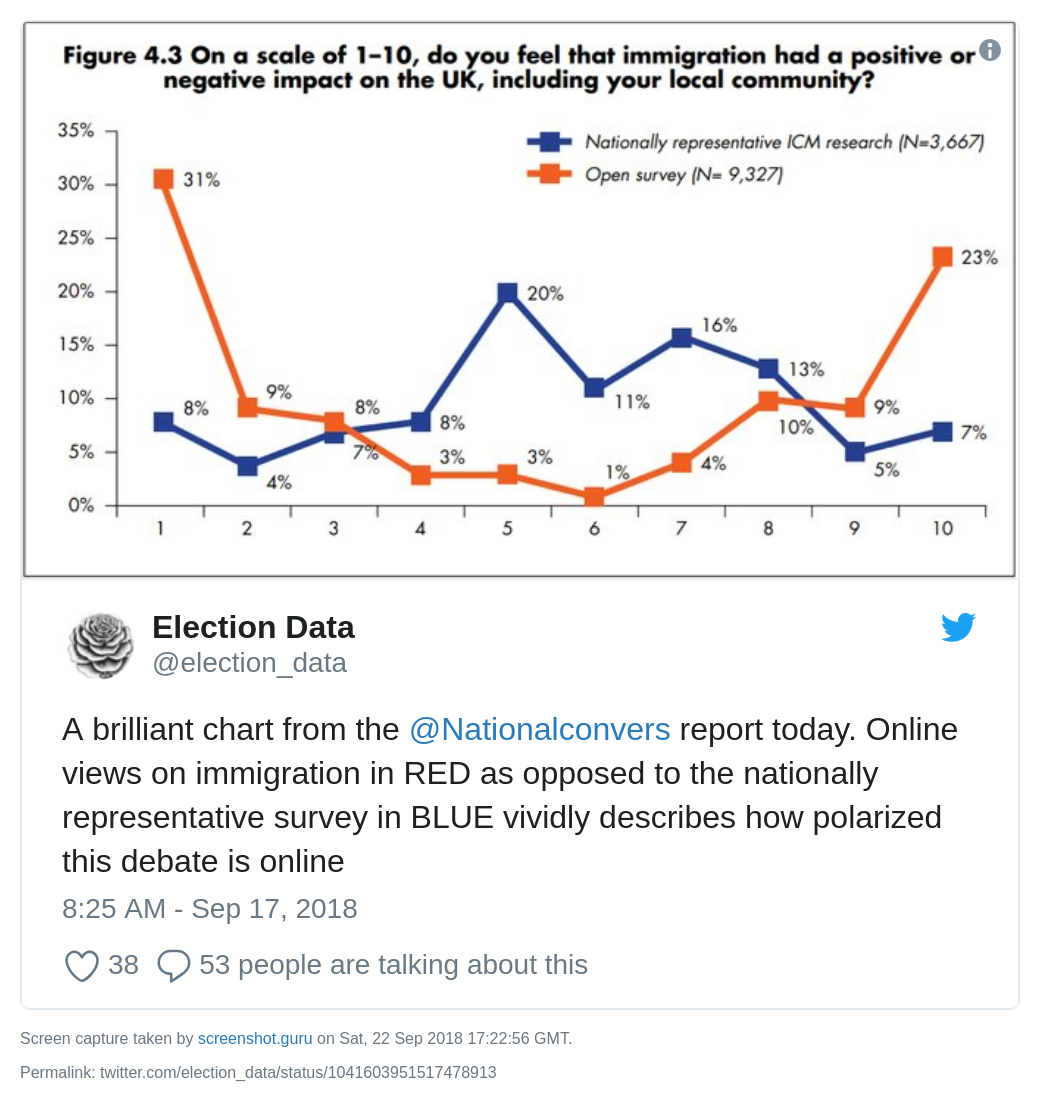
UPDATE: Here’s further data which reinforces the point with a more general finding: self-selecting surveys online are not the same as public opinion.
UPDATE 2: Here’s some further data, including why it may not matter if online views are unrepresentative.
UPDATE 3: An experiment by Lord Ashcroft comparing a Twitter poll with a proper poll showed a big difference between the two.
It may be that this relates to age (older voters often Tory, often not on Twitter) or there could be a tendency for Twits to go with the opposition (not necessarily when it came to actual voting).
I wonder what the analysis would say about Facebook?
It’s as similar story – see the research at https://papers.ssrn.com/sol3/papers.cfm?abstract_id=2791625